The Global Climate 2011-2020: A Decade of Acceleration sounded the alarm, in particular, at the profound transformation taking place in Polar regions and high mountains. Glaciers thinned by around 1 meter per year - an unprecedented loss – with long-term repercussions for water supplies for many millions of people. The Antarctic continental ice sheet lost nearly 75% more ice between 2011-2020 than it did in 2001-2010 – an ominous development for future sea level rise which will jeopardize the existence of low-lying coastal regions and states.
In a glimmer of hope, the report said that the Antarctic ozone hole was smaller in the 2011-2020 period than during the two previous decades thanks to successful and concerted international action to phase out ozone depleting chemicals, an indication of the success of the Montreal Protocol.
“Each decade since the 1990s has been warmer than the previous one and we see no immediate sign of this trend reversing. More countries reported record high temperatures than in any other decade. Our ocean is warming faster and faster and the rate of sea level rise has nearly doubled in less than a generation. We are losing the race to save our melting glaciers and ice sheets,” said WMO Secretary-General Prof. Petteri Taalas.
“This is unequivocally driven by greenhouse gas emissions from human activities,” said WMO Secretary-General Prof. Petteri Taalas. “We have to cut greenhouse gas emissions as a top and overriding priority for the planet in order to prevent climate change spiralling out of control,” he said.
“Our weather is becoming more extreme, with a clear and demonstrable impact on socio-economic development. Droughts, heatwaves, floods, tropical cyclones and wildfires damage infrastructure, destroy agricultural yields, limit water supplies and cause mass displacements,” said Prof. Taalas. “Numerous studies show that, in particular, the risk of intense heat has significantly increased in the past decade.”
The report documents how extreme events across the decade had devastating impacts, particularly on food security, displacement and migration, hindering national development and progress toward the Sustainable Development Goals (SDGs).
But it also showed how improvements in forecasts, early warnings and coordinated disaster management and response are making a difference. The number of casualties from extreme events has declined, associated with improved early warning systems, even though economic losses have increased.
Public and private climate finance almost doubled between 2011 and 2020. However, it needs to increase at least seven times by the end of this decade to achieve climate objectives.
The report was released at the UN Climate Change Conference, COP28, and emphasizes the need for much more ambitious climate action to try to limit global temperature rise to no more than 1.5°C above the pre-industrial era.
The Decadal State of the Climate report provides a longer-term perspective and transcends year-to-year variability in our climate. It compliments WMO’s annual State of the Global Climate report. The provisional annual report for 2023, released at COP28, said that 2023 is set to be the warmest year on record.
The report is based on physical data analyses and impact assessments from dozens of experts at National Meteorological and Hydrological Services, Regional Climate Centres, National Statistics Offices and United Nations partners.
Key Findings:
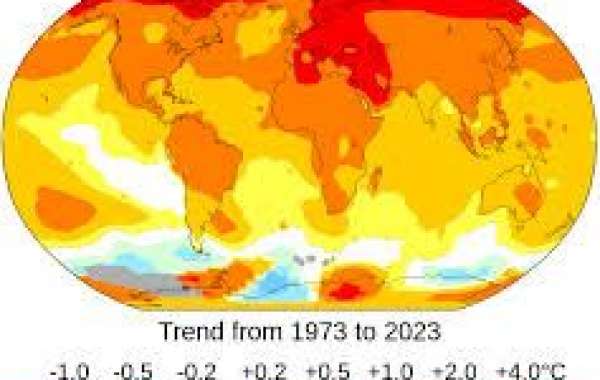
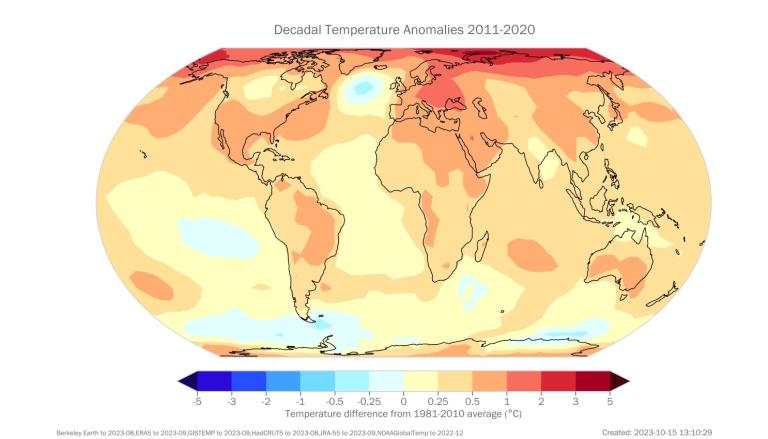
It was the warmest decade on record by a clear margin for both land and ocean.
Global mean temperature for the period 2011-2020 was 1.10 ± 0.12 °C above the 1850-1900 average. This is based on the average of six data sets used by WMO. The warmest six years on record globally were between 2015 and 2020.
Each successive decade since the 1990s has been warmer than all previous decades.
The warmest years of the decade were 2016, because of a strong El Niño event, and 2020. The largest positive anomalies for the decade, in places more than 2 °C above the 1981-2010 average, were in the Arctic.
More countries reported record high temperatures than in any other decade.

Atmospheric concentrations of the three major greenhouse gases continued to increase over the decade.
For about 10,000 years before the start of the industrial era, atmospheric carbon dioxide remained almost constant at around 280 ppm (ppm=number of molecules of the gas per million molecules of dry air). Since then, CO2 has increased by nearly 50% reaching 413.2 ppm in 2020, primarily due to the combustion of fossil fuels, deforestation, and changes in land-use.
The decadal global average CO2 during 1991-2000 was 361.7ppm, during the decade 2001-2010 it was 380.3 ppm, while in 2011-2020 it rose to 402.0 ppm.
During the same periods the average growth rate increased from 1.5 ppm/yr and 1.9 ppm/yr to 2.4 ppm/yr.
In order to stabilize the climate and prevent further warming, emissions must be sustainably reduced.
Rates of ocean warming and acidification are increasing.
Around 90% of the accumulated heat in the Earth system is stored in the ocean. Ocean warming rates show a particularly strong increase in the past two decades.
Ocean warming rates for the upper 2000m depth reached rates of 1.0 ± 0.1 Wm-2 over the period 2006-2020, compared with 0.6 ± 0.1 Wm-2 over the full 1971-2020 period. It reached a record high in 2020 and it is expected that this trend will continue in the future.
A consequence of the accumulation of CO2 in the ocean is its acidification, namely a drop in the oceanic pH, which makes it more challenging for marine organisms to build and maintain their shells and skeletons.

Marine heatwaves are becoming more frequent and intense.
In any given year between 2011 and 2020, approximately 60% of the surface of the ocean experienced a heatwave.
The three years having the highest average of days with marine heatwaves were 2016 (61 days), 2020 (58 days), and 2019 (54 days).
Marine heatwaves have become relatively more intense in the most recent decade. Category II (Strong) events have become more common than those rated in Category I (Moderate). There was an average of 0.5 day extreme marine heatwave (Category IV) per year in the past decade, with 1 full day in the El Niño year 2016. In the past these extreme events – which can change entire ecosystems - were so uncommon that they could hardly be measured on a global scale.
Global mean sea level rise is accelerating, largely because of ocean warming and the loss of land ice mass.
From 2011 to 2020, sea level rose at an annual rate of 4.5mm/yr. This compares with 2.9 +/- 0.5mm/yr in 2001-2010.
Global mean sea level rise has accelerated, mostly due to a speeding up of ice mass loss from the Greenland ice sheet, and, to a lesser extent, due to accelerated glacial melting and ocean warming.
Glacier loss is unprecedented in the modern record.
Glaciers that were measured around the world thinned by approximately 1m per year on average between 2011 and 2020.
The latest assessment based on 42 reference glaciers with long-term measurements reveals that the period between 2011 and 2020 saw the lowest mean mass balances of any observed decade. Some of the mass balance reference glaciers have already melted away, as the winter snow nourishing the glacier melts completely during the summer months.
Nearly all the 19 primary glacier regions have witnessed increasingly large negative values from 2000 to 2020.
The remaining glaciers near the Equator are generally in rapid decline. Glaciers in Papua, Indonesia are likely to disappear altogether within the next decade. In Africa, glaciers on the Rwenzori Mountains and Mount Kenya are projected to disappear by 2030, and those on Kilimanjaro by 2040